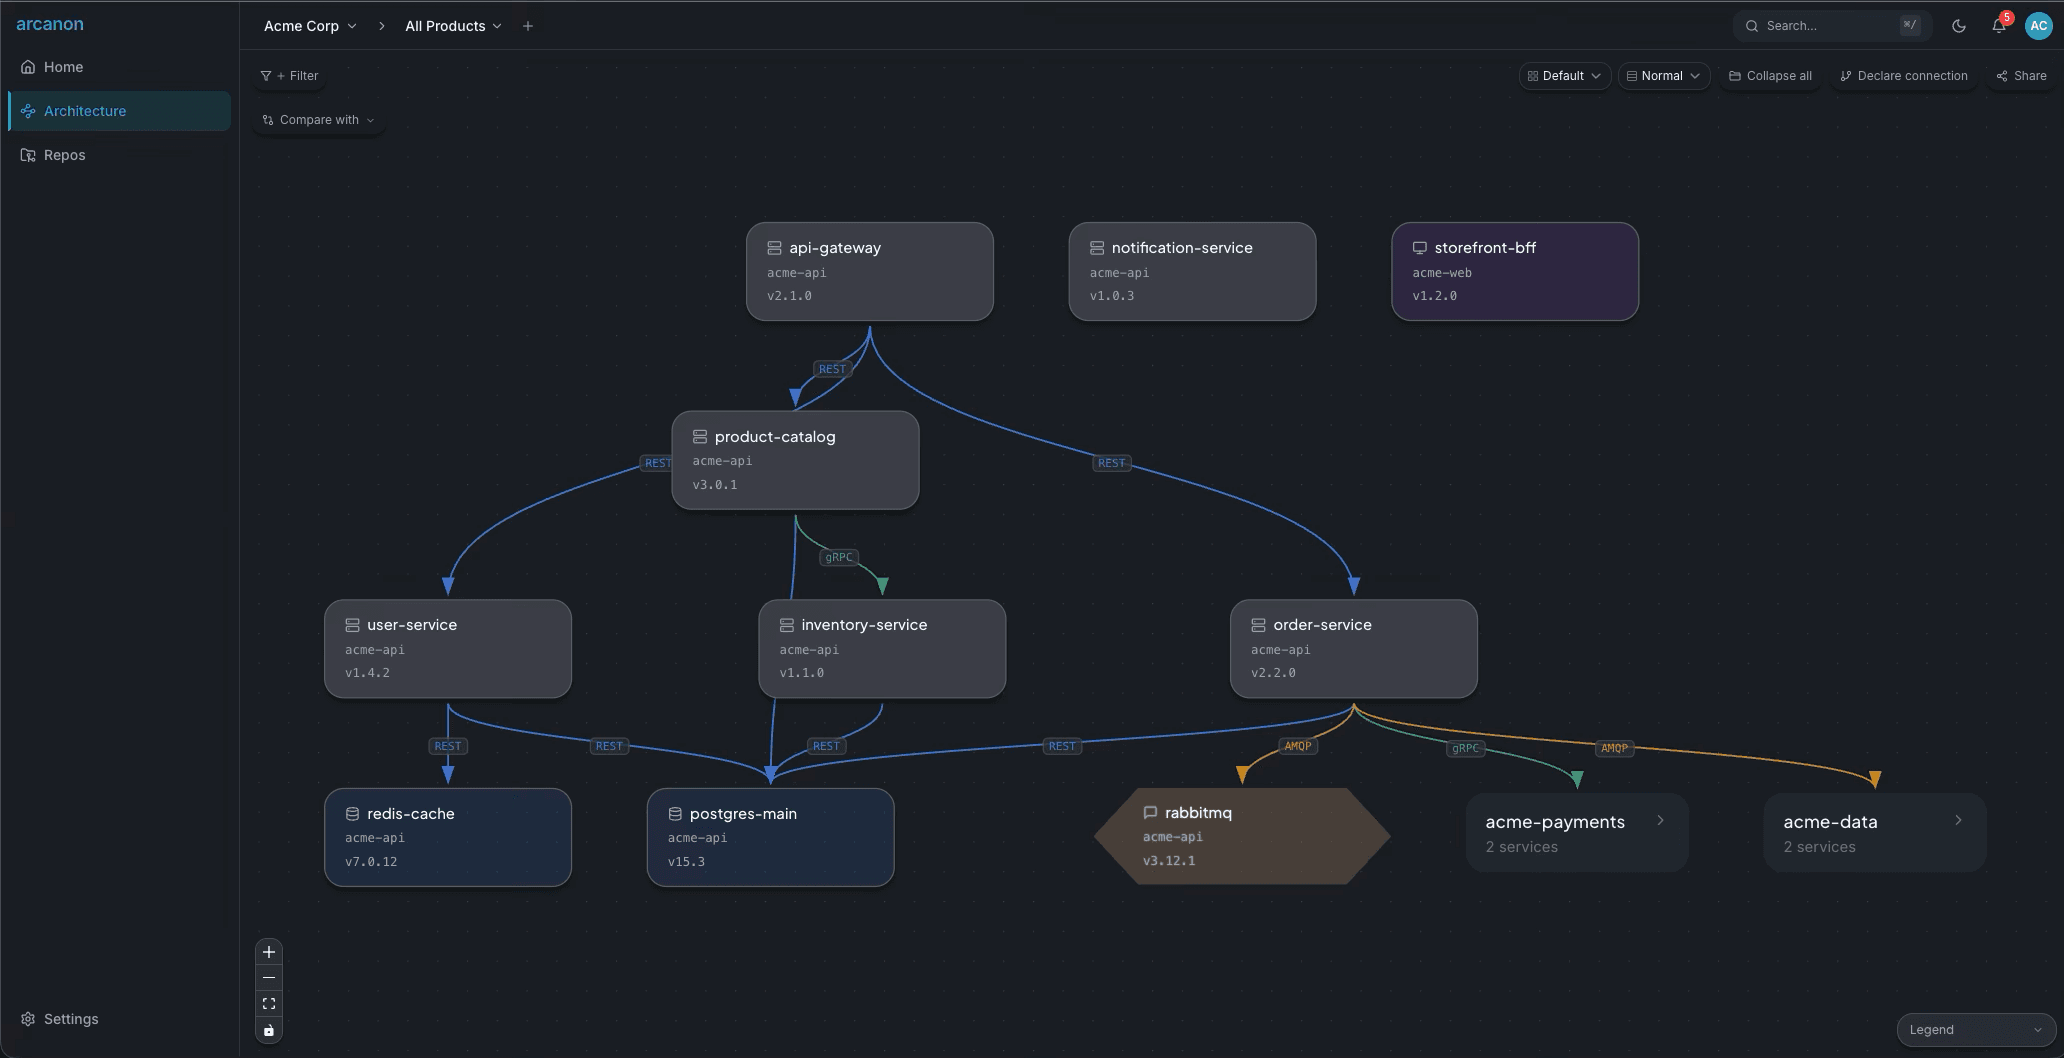
Service Graph
Interactive visualization of your entire service dependency graph.
This page describes the team dashboard at
app.arcanon.dev. For a single-user canvas viewer that runs on your machine — without cross-repo, team, or sharing features — see Local Graph Viewer.
Overview
The Architecture view shows your org's service graph as an interactive canvas. Each node is a service, each edge is a detected connection. Services are grouped by repository — repos with multiple services show as collapsible clusters.
Navigation
- Pan — Click and drag the canvas
- Zoom — Scroll wheel or
+/-keys - Fit view — Press
Fto fit all nodes in view - Select node — Click a service node to open the detail panel
- Expand cluster — Click a repo cluster to show individual services
Filters
Click + Filter in the toolbar to add filters. Available filters:
| Filter | What it does |
|---|---|
| Language | Show only services in a specific language |
| Owner | Filter by team ownership |
| Team | Filter by assigned team (from Settings) |
| Type | Filter by service type (service, database, cache, broker) |
| Repo | Show only services from a specific repository |
Active filters hide non-matching nodes without re-laying out the graph. Click Clear to remove all filters.
Layout options
Use the Layout dropdown in the toolbar:
- Default — Top-to-bottom dependency flow (dagre)
- Hierarchical — Left-to-right layered view
- By Repo — Services grouped into vertical swimlanes by repository
Density controls
Use the Density dropdown:
- Compact — Tighter spacing, reduced edge crossings
- Normal — Default spacing
- Expanded — Maximum spacing, all edge labels visible
Layout and density settings persist in the URL — shared links preserve the view.
Node detail panel
Click any service node to open the detail panel on the right:
- Details — Service metadata, version, owner, endpoints, schemas
- Blast Radius — Upstream and downstream impact analysis
- Drift — Version and type drift for this service
- History — Recent scan results involving this service
The panel can be pinned (click the pin icon) so it stays open when clicking the canvas.
Sharing
Click Share in the toolbar to:
- Copy link — Shareable URL with current filters, selection, layout, and density
- Export JSON — Download the graph data as JSON
- Export PNG — Download a screenshot of the current view
Declared connections
Click Declare connection to manually declare a service-to-service dependency that the scanner hasn't detected (e.g., a queue consumer that uses dynamic routing).